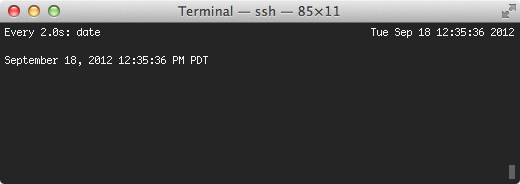
watch - execute a program periodically, showing output fullscreen
Coming from Linux, I have become used to the watch tool. The program is very simple,
it lets you run a command at a given interval, and update the terminal with the output.
It’s like a simple while loop that runs a command, but it uses ncurses to update the view,
which makes it easy to spot differences.
Compiling it on SmartOS was straight forward, the hardest part
was finding the source of watch(1). It turns out it is bundled with a handful of tools
for dealing with the Linux proc filesystem. Because of this, most of the tools wont compile
(or be useful) on an Illumos based operating system, so the Makefile proved to
not be helpful.
I was working on my latest module for node, latest, when I encountered
a problem. While testing, I noticed output being written to the terminal
that I wasn’t generating. This means that some module had the audacity to
write directly to the terminal… bad.
My project was only including the npm module, however the npm module included
its own handful of other modules, and they included their own modules, and so-on.
If I were to look through the source myself to try and find what was outputting to
the terminal it would have taken forever, trying to trace what function was calling what.
Instead, I decided to override the stdout streams write function, to
stack trace when invoked. This means that any function that writes to stdout
will cause a stack trace to be printed to the screen.
This module provides the best of both worlds of spawn and exec
It will simply return 2 strings containing stdout and stderr
(like child_process.exec), but will take an array of process arguments
(like child_process.spawn) to avoid any nasty shell expansion.
I wrote up a super small module to mimic clear on the command line for
Node.js. I was surprised when I didn’t find a module that already
did this in npm.
I wrote this module as a way to help organize my collection of flac
and mp3 files. It can automatically inspect your music files
metadata tags, and rename the files based on them.
I like to have both Chromium and Chrome installed on my mac, but installing Chromium
is not as easy as installing Chrome. Chromium required me to find the tarballs that
were generated from the Chromium source control, and to make sure that I was only pulling
the tarball if my Chromium version was out of date. Because of this, mac-chromium was born.
I wrote destruct to tackle the problem of unpacking binary buffers in Node easily.
Based off the unpack function in Perl, and inspired by prustat
by Brendan Gregg, this module makes it simple to take a binary buffer object, and a
format string to unpack values. There were other modules that claimed to have the same functionality,
but most of them were too poorly documented with the source code almost unreadable, while the
others were overcomplicated and didn’t support a simple format string.
This module does not handle all data types, it has only been tested on SmartOS,
and was built for making it easier to extend the proc Node module by @dshaw.
Easily and automatically cast common datatypes in JavaScript
I was working on parsing output from the command line while creating the
Node SMF module. This required me to inspect the elements individually
and write case statements to expect certain data types be returned.
What I mean by this is…
When you parse the command line, everything gets returned as a string.
So, you must do some post-processing to cast items that look like numbers
to numbers, strings that look like keywords to keywords, ie 'false' to false, etc.
So, autocast was born. This module will do all of that inspection for you
and return what it thinks the object should be.
The graph on the left shows read system call latency, and the graph on the
right shows write system call latency (syscall::read*:entry and
syscall::write*:entry respectively). The bottom portion is a modified oneliner
to show files opened by a process (excluding gnuplot) taken from Brendan
Gregg’s DTrace oneliners.
At 0:45, I induced latency by reading /usr/share/dict/words and writing the
contents out to the screen in a 1 second loop. This becomes visible in large
spikes on the graph showing write latency, but the read latency graph is almost
unaffected.
The X-axis on both graphs show time (ticking every second) in the form of
MM:SS. The Y-axis represents the time in milliseconds, and each point is a 1
second average aggregation of the latency.
Because of the nature of gnuplot in this experiment, the Y-axis adapts to the
visible metrics, so when the latency is induced, the Y-axis grows from ~.005ms
to ~2ms.